What the Fire Danger Class tells us about wildfire risk
May 06, 2021
Fire Behaviour
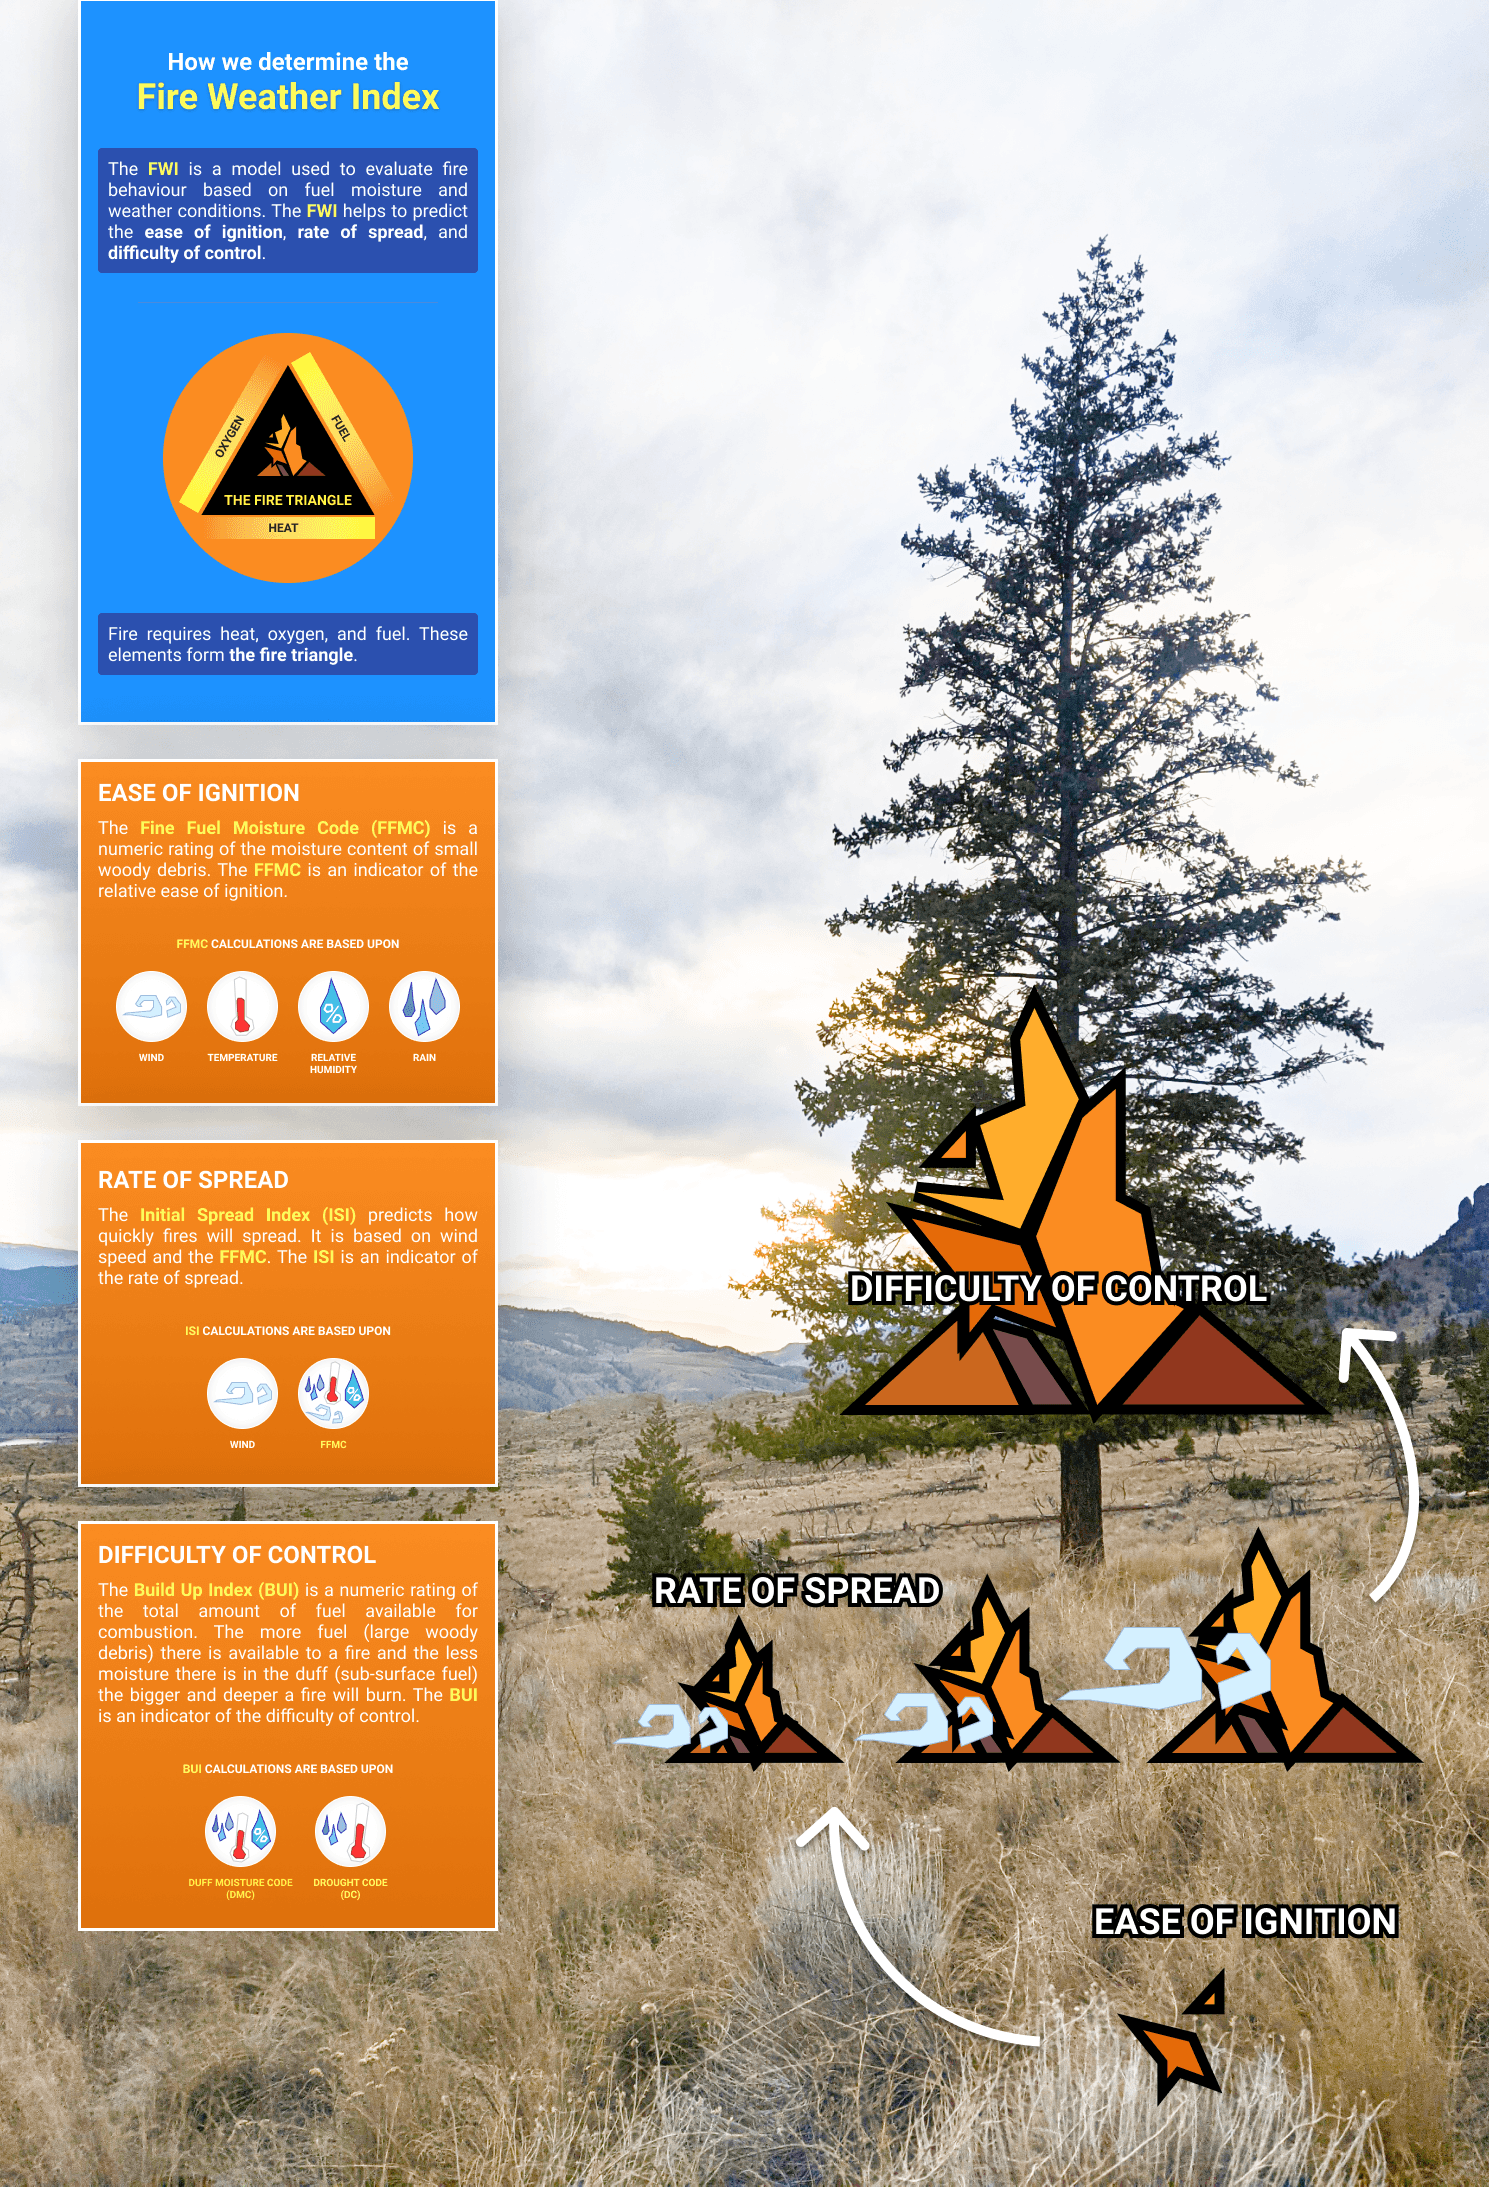
There are many steps to fire behaviour which makes it hard to attach a single number or rating to such a complex problem. Fire behaviour can include ease of ignition, rate of spread, and difficulty of control, just to name a few.
EASE OF IGNITION refers to how much “work” is required to get a fire to start. The fire triangle teaches us that this is controlled primarily by three elements: oxygen, heat, and fuel.
RATE OF SPREAD tells us how far and how fast the fire will travel, once started. This is controlled by many factors including fuel type, wind speed, topography, and how dry the fuel is.
DIFFICULTY OF CONTROL refers to the intensity of the fire. Again, once it's started, how big and how hot will it get? How long will it burn for? In addition to many of the same factors as the rate of spread, this is controlled by historical weather events such as how dry and hot the last few weeks and months have been. That will tells us how deep a fire is going to burn, whether the flames are tall enough to move from the ground into the tree branches (this is known as the height to live crown base), and what the spotting* potential is.
*Spotting: when a fire produces a spark or ember that is carried by the wind and starts a new fire beyond the main fire zone.
Fire Weather
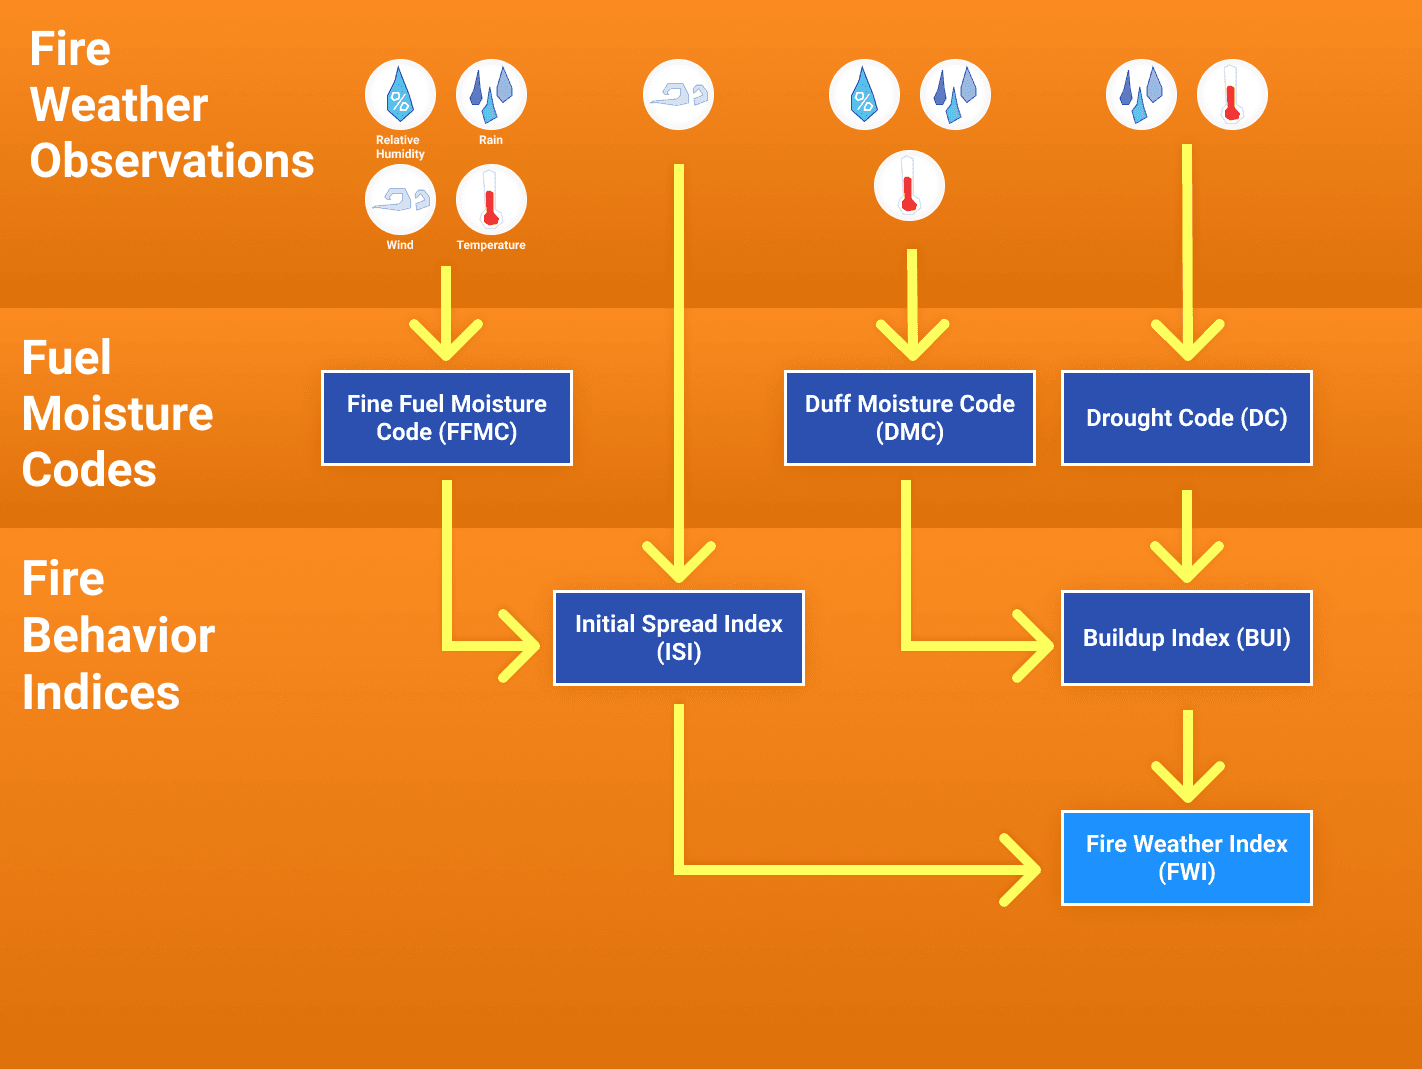
Another way of looking at wildfire is using the Canadian Forest Fire Weather Index (FWI) System. The FWI is a model that is used to evaluate fire behaviour in terms of fuel moisture and weather conditions. The main inputs are temperature, relative humidity (RH), wind, and rain as you can see in Figure 2. These are the weather observations, things you can record out on the landscape. From these, three different fuel moisture codes are calculated, the Fine Fuel Moisture Code (FFMC), the Duff Moisture Code (DMC), and the Drought Code (DC). These codes represent an estimate of how much moisture in present in the fuels. The FFMC represents the moisture content in the fine fuels and small woody debris. The DMC represents the moisture content in medium sized woody debris and the initial sub-surface earth layer. The DC represent the moisture in the deep, sub-surface fuels. From these fuel moisture codes we derive fire behaviour indices, the Initial Spread Index (ISI), Build Up Index (BUI), and then finally the Fire Weather Index. The ISI represents the fire's potential rate of spread, the BUI is a sum of the available fuel and its ability to burn, and the FWI is a numerical representation of the overall fire danger. However, that is not directly the number used to inform the public. From the FWI (and the BUI) another value is calculated and that is the Fire Danger Class (DGR) so let's look at that next.
Fire Danger
So what is the Fire Danger Class (DGR) and how is it calculated?
The DGR is calculated as a combination of the BUI and the FWI. This is quite interesting because if you look at Figure 2, you can see that the FWI is calculated using the ISI and the BUI. What this means is that the DGR is actually weighted two-fold towards the BUI.
In reality it's not quite that simple. Here is the actual calculation:
function dgr_calculation(isi, bui) {if (bui > 80.) {bb = 0.1 * isi * (1000.0 / (25.0 + 108.64 / Math.exp(0.023 * bui)))} else {bb = 0.1 * isi * (0.626 * Math.pow(bui, 0.809) + 2.0)}if (bb <= 1.) {fwi = bb} else {fwi = Math.exp(2.72 * Math.pow(0.434 * Math.log(bb), 0.647))}return fwi}
As you can see, if the BUI is greater than 80 then the FWI actually grows exponentially with the BUI.
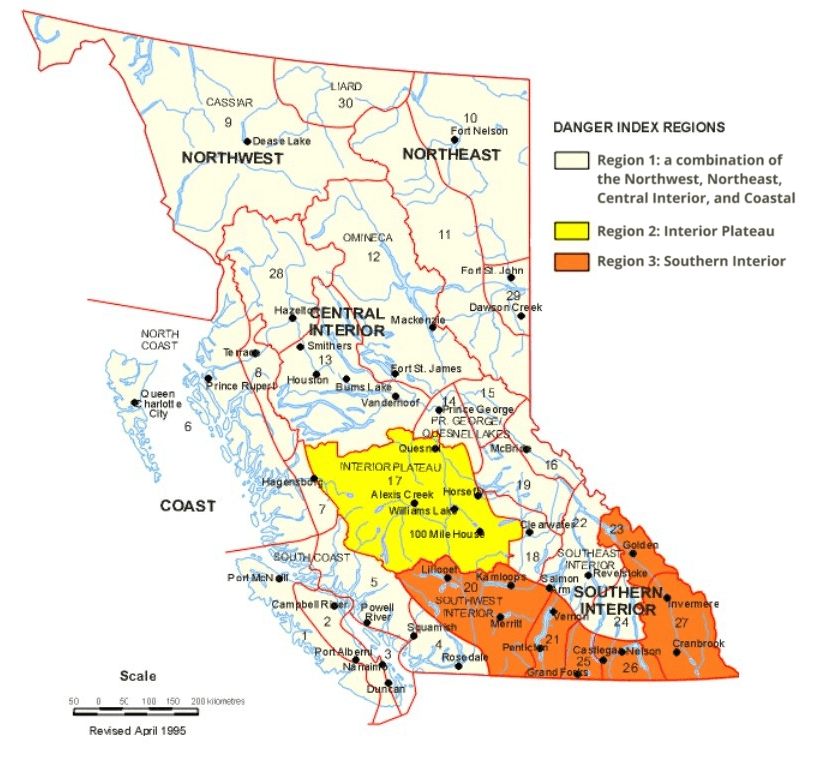
Another important thing to consider is that the DGR is a value specific to wildfires in British Columbia (BC) and in order to calculate the ratings, BC has been separated into three Danger Regions to account for differences in topography and fuel types. This means that the mapping between the FWI and BUI is region dependent.
Danger Region 1
| Build Up Index (BUI) | Fire Weather Index (FWI) | |||||
|---|---|---|---|---|---|---|
| 0 | 1 - 7 | 8 - 16 | 17 - 30 | 31+ | ||
| 0 - 19 | I | II | II | III | III | |
| 20 - 42 | II | II | III | III | IV | |
| 43 - 69 | II | III | III | IV | IV | |
| 70 - 118 | II | III | IV | IV | V | |
| 119+ | III | III | IV | V | V | |
Danger Region 2
| Build Up Index (BUI) | Fire Weather Index (FWI) | |||||
|---|---|---|---|---|---|---|
| 0 - 4 | 5 - 16 | 17 - 26 | 27 - 37 | 38+ | ||
| 0 - 48 | I | II | II | III | III | |
| 49 - 85 | II | II | III | III | IV | |
| 86 - 118 | II | III | III | IV | IV | |
| 119 - 158 | II | III | IV | IV | V | |
| 159+ | III | III | IV | V | V | |
Danger Region 3
| Build Up Index (BUI) | Fire Weather Index (FWI) | |||||
|---|---|---|---|---|---|---|
| 0 - 4 | 5 - 16 | 17 - 27 | 28 - 46 | 47+ | ||
| 0 - 50 | I | II | II | III | III | |
| 51 - 90 | II | II | III | III | IV | |
| 91 - 140 | II | III | III | IV | V | |
| 141 - 200 | II | III | IV | IV | V | |
| 201+ | III | III | IV | IV | V | |
It's easier to make sense of this if we relate the BUI and ISI back to the fire behaviour that we were talking about at the top, things we can actually see in real life. In rough terms the FFMC represents the ease of ignition, the BUI represents the difficulty of control (and mop up* considerations), and the ISI represents the rate of spread.
*Mop up: The final stages of fire suppression, once the fire is under control, where fire crews seek and extinguish any remain heat in burned areas and along the edges.
💡
Working Examples
Let's look at this with some examples.
Scenario #1: Long dry days followed by a day of heavy rain
It's the beginning of August. It's been a hot and dry season. Fire crews and resources are exhausted and stretched thin. Yet yesterday it rained hard and heavy all day long. You wake up this morning, look out the window, and see that it's still raining. Not as heavy as yesterday. More of a light mist and think to yourself “everything is soaked and the rain has eased up enough for me to do some work out there.” But what do the ratings say?
Well the rain has caused the FFMC to drop to 77 and with the wind forecasted for around 17km/h today, that puts the ISI at 2. The BUI however is not impacted nearly as much by short term weather and therefore it's still sitting at 163. An ISI of 2 and a BUI of 163 puts the FWI at 12 which for regions 1 and 2 puts the DGR at 4 (high). Now because the DGR has been at 5 (extreme) for more than three days and we have not yet had the DGR back down to 4 for three or more days, the work restrictions are actually still in effect. All high risk activities on or within 300m of forest land or grass land must be ceased.
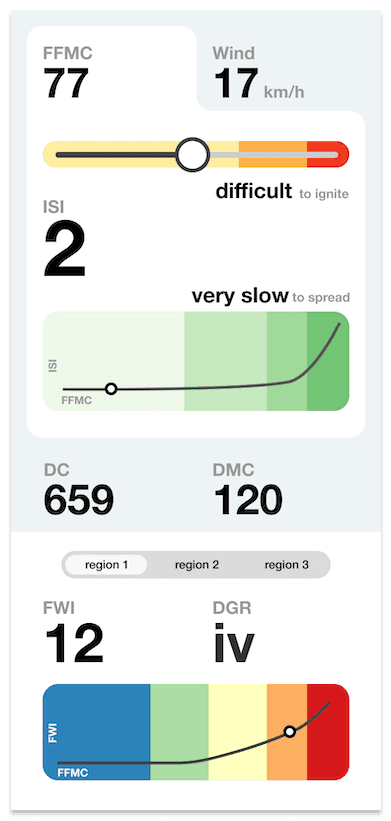
Why is that? After all, with everything so wet, nothing is going to ignite right? With an FFMC at 77, the ease of ignition is difficult. The problem arises if a fire does start. With a BUI at 163, the difficulty of control is still high and with the fire crews already stretched thin and warn out, risking another out of control fire would not be a good thing. The surface and fine fuels are wet and not easily burnable but if it gets into the duff layer, that will still be dry and fires can smoulder under ground for quite some time. So if an ember was to make it into that layer and the rain ceases and the conditions get hot and dry again, that ember could become a raging fire in very short order.
If we look on the flip side, in conditions where the BUI is low and the ISI is high, what does that look like?
Scenario #2: Snow melt and warm spring days
It's the Easter long weekend. The snow is finally gone but the grass is still dead. It's the perfect time to burn the fields in preparation for this years growing season. This past week has been a beautiful spring week. Lots of sun, little rain, and warm spring temperatures. The same is forecasted for this weekend. You wonder to yourself &lrquo;is it safe to burn?”
Well it looks like our BUI is at 17. Since the snow just finished melting, all of that water is still sitting in the ground making it not conducive to burning. Yet the temperatures have been high so our FFMC is at 89. Unfortunately there is also moderate winds forecasted for tomorrow, 20km/h. That puts our ISI at 10. With a BUI of 17 and an ISI of 10 our FWI is 13 which is basically the same as scenario #1. Yet our DGR is 2 (low) across all regions meaning it's safe to burn.
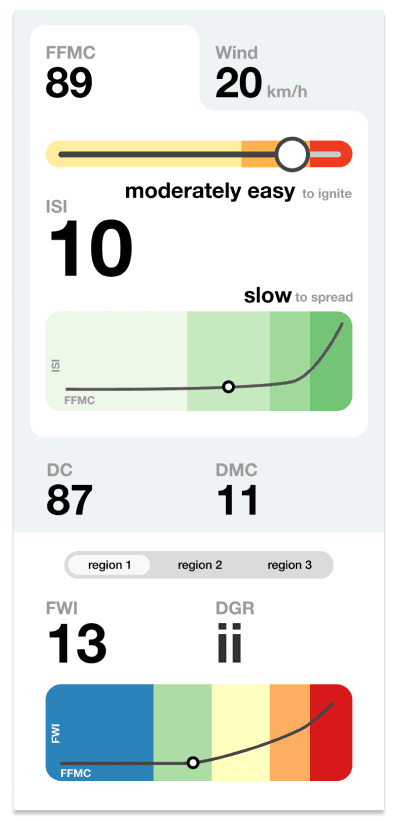
Why might that be? Well with a BUI at only 17, even if the fire rips through the grass lands, once it reaches the heavy timbers, those fuels are still containing too much moisture and the fire doesn't have enough intensity to get them to ignite. The ease of ignition is very easy since the fine fuels are dry, the spread rate would be moderate to fast but it will also be easy to control because it won't get into the sub-surface fuels or into any of the medium to large woody debris. In addition, it's early in the season and conditions have been low up until this point meaning that the crews are fresh and available. It's a very different outlook than in scenario #1.
Visualization
It has taken a bit to wrap our heads around how all the elements tie together and influence each other so, as we like to do, we've building an interactive visualization to help us and others experiment with different scenarios.
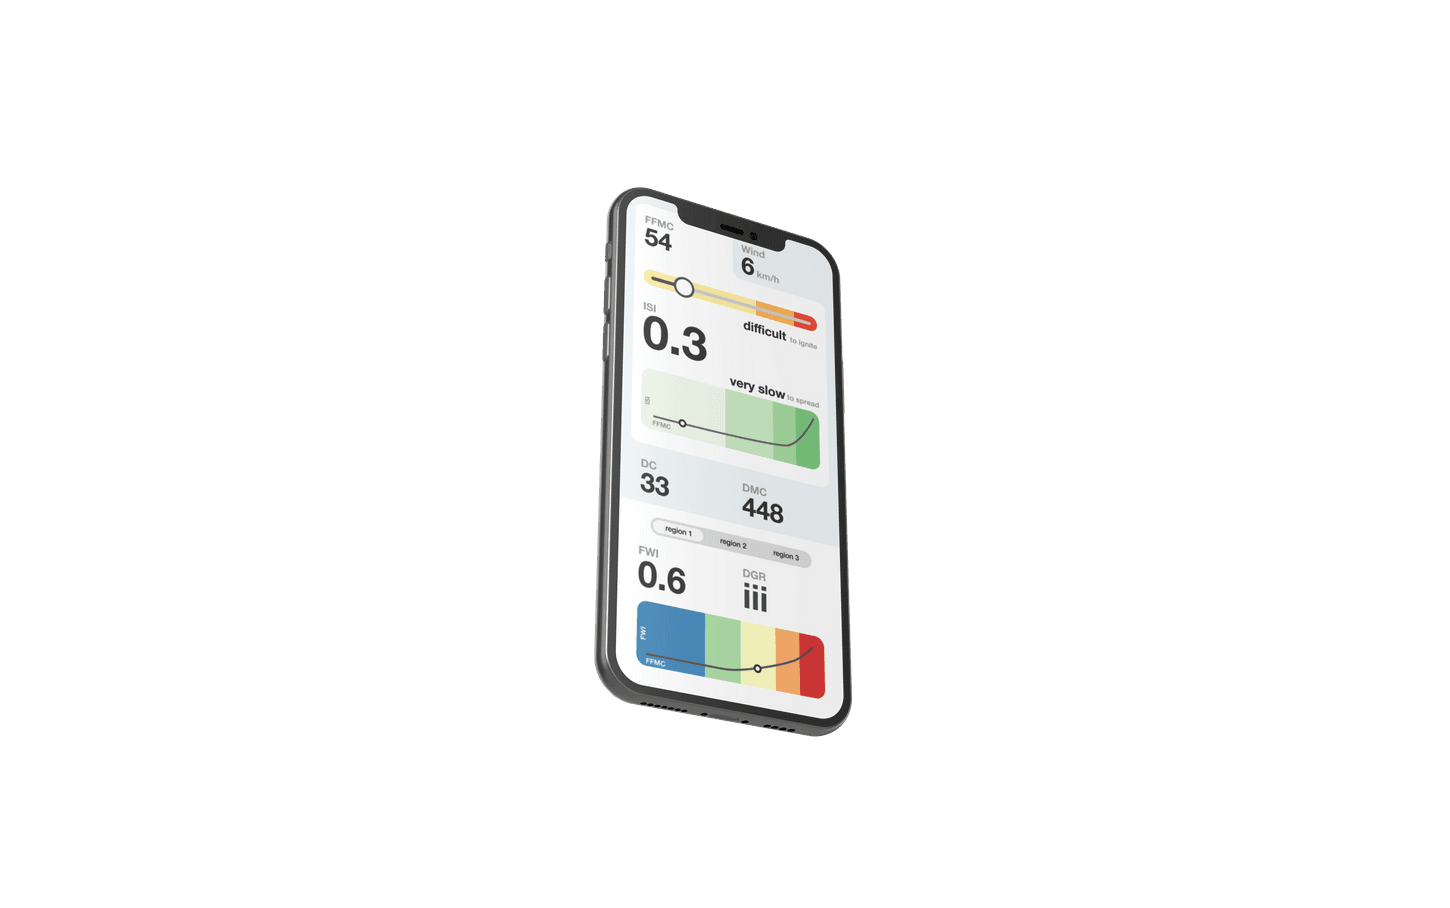
📲
⚠️
All of this aside, it's critical to keep in mind that the ojective of the DGR is to use the calculated values of the FWI and BUI to indicate the fire load experienced at those values relative to the average or usual fire load. The Fire Danger Class (DGR) is NOT an indicator of fire behaviour!
For instance, Danger Class III, does NOT mean moderate fire behaviour potential. It actually means that in the past, when one of the stations used in the calibration reach Danger Class III, the average conditions experienced in the area during from 1970 - 1973 were:
Region 1:
- 29.1% of the days each year are this class
- 31.1% of the man caused fires occur on these days
- 13.1% of the total acreage burned results from these fires
Region 2:
- 25.4% of the days each year are in this class
- 30.7% of man caused fires occur on these days
- 5.4% of the t.otal acreage burned results from these fires
Region 3:
- 25.4% of the days each year are in this class
- 26.4% of the man caused fires occur on these days
- 8.5% of the total acreage burned results from these fires
Safe Work Restrictions
So why is this relevant and how can we apply it? Well under the Wildfire Act (Section 6) “a person who carries out a high risk activity on or within 300m of forest land or grass land on or after March 1 and before November 1, unless the area is snow covered, must determine the Fire Danger Class for the location of the activity” to determine whether there are work restrictions in place.
What is a high risk activity?
A high risk activity is any of the following jobs:
- mechanical brushing
- disk trenching
- preparation or use of explosives
- using fire- or spark-producing tools, including cutting tools
- using or preparing fireworks or pyrotechnics
- grinding, including rail grinding
- mechanical land clearing
- clearing and maintaining rights of way, including grass mowing
- any of the following activities carried out in a cutblock excluding a road, landing, roadside work area or log sort area in the cutblock:
- operating a power saw
- mechanical tree felling, woody debris piling or tree processing, including de-limbing
- welding
- portable wood chipping, milling, processing or manufacturing
- skidding logs or log forwarding unless it is improbable that the skidding or forwarding will result in the equipment contacting rock
- yarding logs using cable systems
What is a work restriction?
Depending on the fire danger rating, the government decides whether or not it's safe for high risk activities to continue. Under some circumstances, those activities are simply restricted to certain hours of the days, or require a fire watcher for a certain number of hours after activities have stopped. However, in other scenarios it requires that all high risk activities cease for the entire day which, for some folks, means a substantial financial loss. For this reason, and for the safety of people and property, it's important to know what the restrictions are. Schedule 3 of the Wildfire Act gives you the following table to use to determine the restrictions.
| Fire Danger Class (DGR) | Restriction | Duration |
|---|---|---|
| III (moderate) | After three consecutive days of DGR III or greater, maintain a fire watcher after work for a minimum of one hour. | Until after the fire danger class falls below DGR III. |
| IV (high) | Maintain a fire watcher after work for a minimum of 2 hours. | Until after the fire danger class falls to DGR III for 2 consecutive days of falls below DGR III. |
| After three consecutive days of DGR IV, cease activity between 1 p.m. Pacific Daylight Saving Time and sunset each day. | ||
| V (extreme) | Cease activity between between 1 p.m. Pacific Daylight Saving Time and sunet each day and maintain a fire watcher after work for a minimum of 2 hours. | Until after the fire danger class falls below DGR IV for 2 or more consecutive days. |
| After 3 consecutive days of DGR V, cease activity all day. | Until after the fire danger class falls to DGR IV for 3 or more consecutive days or falls below DGR IV. |
At a first glance it seems fairly straight forward to calculate. First you figure out what the Fire Danger Class (DGR) is at the location of operation. You do so by finding the FLNRO weather station that is most representative of your work location and find what DGR it's reporting. Once you have today's rating then you go to the table above to interpret what the restrictions are. In some instances you also need to look back a couple of days to know what the restriction is. It does get a little confusing depending on the scenario so let's look at some more examples!
Scenario #1: The Fire Danger Class has been at extreme (V) for the last three days but today it has dropped to moderate (III)
Today
3Yesterday
52 Days Ago
53 Days Ago
5When it has been three consecutive days of DGR V the table above says that you must “cease activity all day until after the fire danger class falls to DGR IV for three or more consecutive days OR falls below IV”. Today we are sitting in the latter part of that statement meaning that the previous restriction no longer holds. So now, because today is DGR III we go back to the row for DGR III and read through it's restriction and what it say there is that “after three consecutive days of DGR III or greater (which is what has happened), maintain a fire watcher after work for a minimum of one hour.” Therefore the conclusion is:
⚠️
Scenario #2: The Fire Danger Class has been at High (IV) but today it's dropped to Low (II).
Today
2Yesterday
4This is a fairly easy scenario. If today's rating is DGR II or DGR I, regardless of the previous days, it's safe to work.
✅
Scenario #3: The Fire Danger Class has been at High (IV) for the last two days, before that it was at Extreme (V) but only for one day.
Today
4Yesterday
42 Days Ago
53 Days Ago
3The DGR was at V within the last five days which means we need to first verify the conditions of the Extreme row before going to the conditions for the High row. Under the DGR V conditions it states that we must “cease activity between 1pm PDT and sunset each day and maintain a fire watcher after work for a minimum of 2 hours until after the fire danger class falls below DGR IV for two or more consecutive days.” What this means is that because it was at DGR V and has yet to fall below DGR IV we must still abide by this work restriction.
🔥
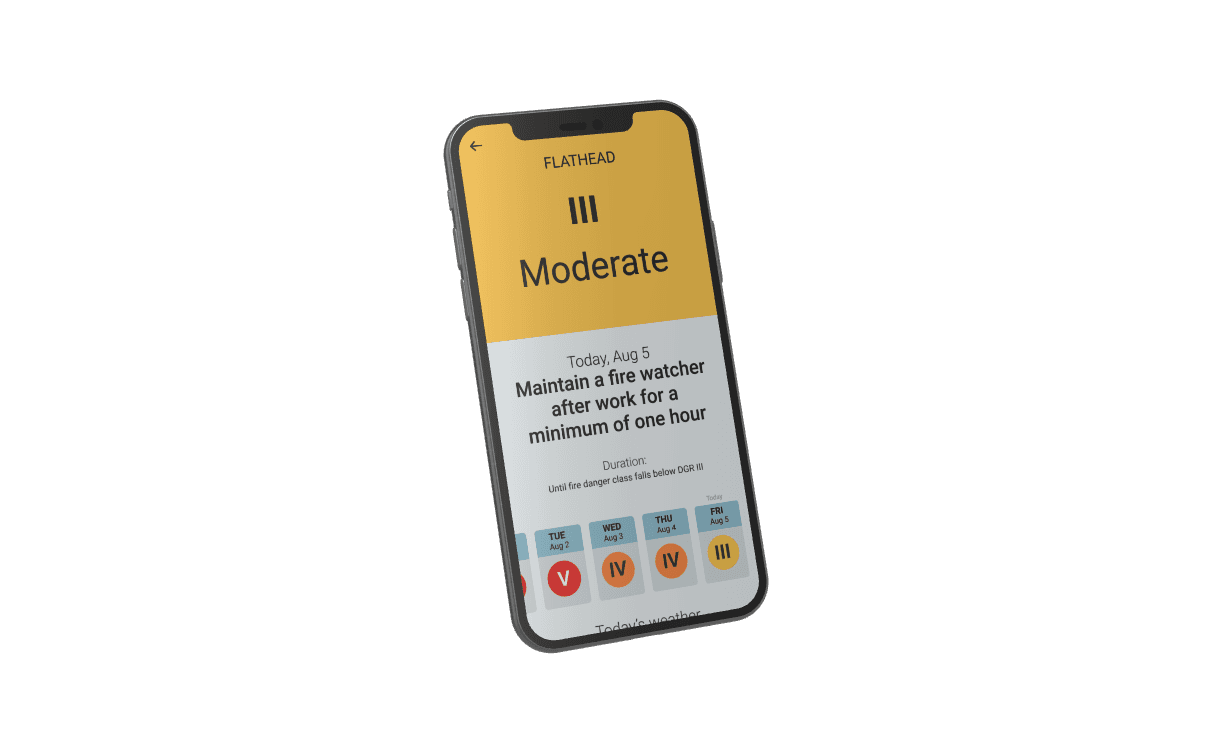
Another Visualization
A little confusing, hey? For this reason we're also working on building a little tool for industry folks to use to get an immediate understanding of what the restriction is without having to look through the data themselves. Just choose your weather station, eh voilà!
📲
Do you work for an industry that is impact by wildfire restrictions every summer? We'd love to hear what your experience is with monitoring the fire danger classes and how it compares to what you see out in the real world. Let us know on Facebook, Twitter, or by email.